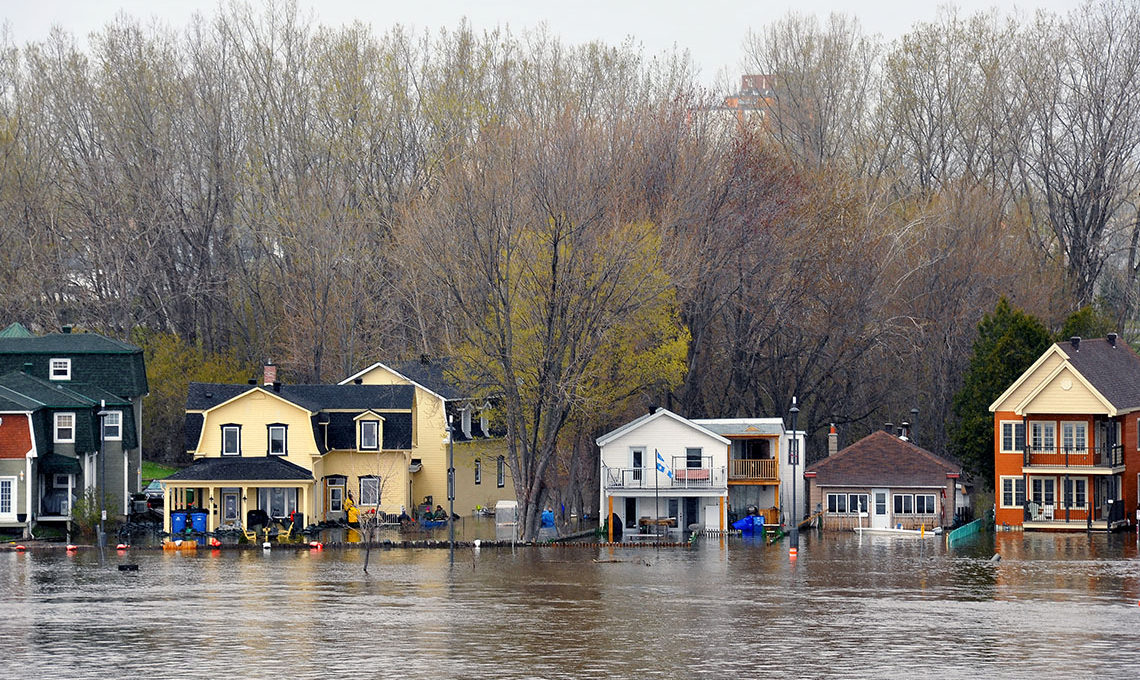
This is how climate change will affect your community
To most of us, climate change effects like rising sea levels, shrinking Arctic ice, and more frequent extreme weather events are abstract phenomena. We see them reported in the media but don’t feel the consequences in our own lives. This may lead us to underestimate the urgency of taking action. Therefore, researchers at the University of Prince Edward Island (UPEI) in Canada have created a tool that’s able to visualize the changes about to take place at local communities.
CLIVE (Coastal Impacts Visualization Environment) combines an array of data sources including historical erosion data, model projections of sea-level rise, drone-based aerial imagery, and high-resolution elevation data to create visualizations of local climate change effects. Furthermore, 3D game technology allows users to fly over their own communities and intimately observe changes over time – 30, 60, and 90 years into the future. Users can select different climate models to see the full range of sea level rise and erosion predictions, and navigate from any perspective, at any scale.
First applied for Prince Edward Island
CLIVE is created by the UPEI Climate Research Lab with input from the Spatial Interface Research Lab at Simon Fraser University in British Columbia. The tool’s effectiveness lies in its ability to work with terabytes of data from over 50 global climate models and to incorporate huge 3D datasets for realistic terrain modeling.
Canada’s National Research and Education Network (NREN) and its provincial partner in New Brunswick and Prince Edward Island, Educational Computer Network (ECN), make this data-intensive work possible. Twelve provincial and territorial partners and CANARIE form Canada’s NREN, connecting Canada’s researchers, educators, and innovators to each other and to data, technology, and colleagues around the world.
CLIVE researchers leveraged CANARIE and ECN to build their visualization tool four years ago, producing a report for the government of Prince Edward Island not long after. The report recommended 86 changes in 10 key sectors of the island society including changes to crop varieties, land-use planning, and household insurance.
Even individual farms are visible
The government of Prince Edward Island went on to schedule consultations with communities across the island, asking researchers to present not only their findings, but local visualizations as well. Residents were able to see for themselves what their coastlines, cities, and even individual farms would look like in several decades.
Since then, CLIVE and its findings have been widely covered by Canadian media. Several organizations have contacted UPEI requesting CLIVE to be brought to their communities. UPEI researchers continue to leverage CANARIE to work with national and international collaborators, gathering the necessary climate datasets, and high-resolution geospatial data to adapt CLIVE for other areas, including a new initiative in Los Angeles, USA.
Image credit: Paul McKinnon/Shutterstock.com
For more information please contact our contributor(s):

